
By Keith Sampson, Senior Vice President, Energy Services & Max Webb, Managing Director of Pricing Analytics
The 2024-25 winter began with record high natural gas storage levels, historically low natural gas New York Mercantile Exchange (NYMEX) futures prices, and weather forecasts pointing to a mild season. The Northeast U.S., though, experienced prolonged cold weather resulting in much higher than anticipated energy prices. In this blog, we will recap the 2024-25 winter, cover what has (and has not) changed with the northeast natural gas landscape over the last decade and explore how these changes have impacted winter natural gas prices. We will also outline key findings that can help consumers mitigate the risk of cost spikes in future winters.
Winter 2024-25 Recap
Last fall, U.S. natural gas storage inventory levels were at a five-year high, indicating the U.S. had plentiful resources to meet heating demand for the upcoming winter season. Helped by high storage levels, the 2024 natural gas NYMEX average price (adjusted for inflation) was the lowest ever recorded, according to the U.S. Energy Information Administration (EIA). With weather forecasts signaling another mild winter – coupled with these bearish natural gas price signals – the energy industry widely expected the trends from the last three years would continue: below average natural gas and electricity prices across the northeast.
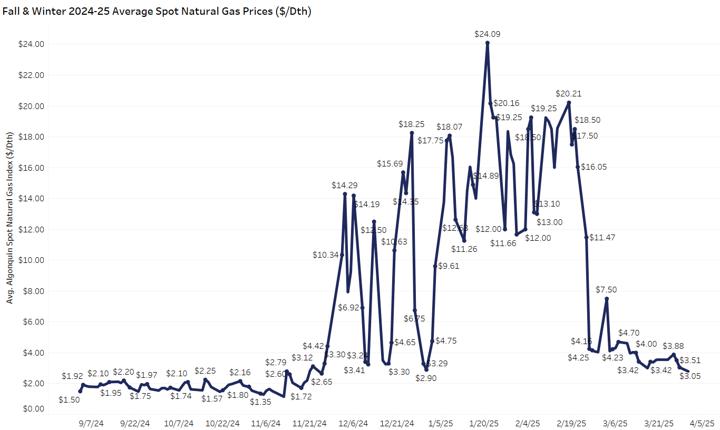
But by mid-December, that outlook shifted dramatically when the weather pattern flipped, and New England endured one of its coldest winters in ten years. The cold weather, along with bullish liquified natural gas (LNG) export forecasts under a pro-LNG presidential administration, caused natural gas and electricity spot prices to surge and remain expensive through February 2025. Figure 1 shows the natural gas spot price increase in response to tightening supply and demand conditions driven by colder weather. Electricity spot prices are closely correlated to natural gas prices, as natural gas is the primary fuel source used for generating electricity.
FIGURE 1 - Fall & Winter 2024-25 Average Spot Natural Gas Prices, Competitive Energy Services, 2025
What has - and has not - changed with New England Natural Gas?
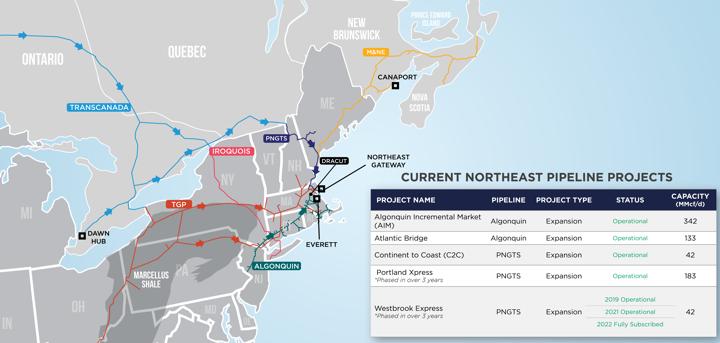
One key factor that has not changed is the New England natural gas pipeline infrastructure. Shown as the green line in Figure 2, the Algonquin Gas Transmission (AGT) system is a 1,100-mile interstate pipeline owned by Enbridge that moves gas from New Jersey into New England with a capacity of 20 billion cubic meters per year. While some pipeline expansions have occurred over the last decade, most notably on the southern leg of the AGT system, there is still inadequate pipeline capacity to deliver natural gas to New England population centers – particularly when consumers and the electricity grid need it the most – during periods of extreme cold weather. In fact, New England faces an estimated 50 percent shortfall in interstate gas supply during peak demand days. This is a result of the reliance on natural gas to meet heating demand while also being the primary fuel source for electricity generators.
FIGURE 2 - Northeast Pipeline Map, Competitive Energy Services, 2025
Since there is little hope for additional pipeline infrastructure, the New England Independent System Operator (ISONE) has implemented various winter fuel reliability programs to mitigate the impact of natural gas supply shortfalls during peak periods. The more recent fuel security programs, Mystic Cost of Service and Inventoried Energy Programs, were detailed in previous CES Insights blogs titled Fuel Security: New England’s Biggest Winter Concern and Fuel Security Update: New England and Beyond.
For a brief refresher, the Mystic Cost of Service program was created to delay the retirement of the Mystic Generating Station – a large LNG fired generator located outside of Boston – for an additional two-year period from June 2022 through May 2024 due to grid reliability concerns.
The second fuel security initiative, Inventoried Energy Program (IEP), was created to help ensure that participating generators have enough fuel stored on-site (e.g. oil, liquified natural gas, or coal) instead of relying on scarce, expensive pipeline natural gas delivered during peak winter periods.
Additionally, in 2024, several of New England’s major natural gas utilities (Eversource, National Grid, and Unitil) signed six-year contracts with the Everett LNG import terminal located in Boston. Everett provides an alternative source of natural gas to the region that is not impacted by inter-regional pipeline constraints. The utility contracts ensure the critical liquified natural gas supply injection point remains operational for at least the next five years.
These actions were aimed at addressing the supply and demand crunch caused by New England’s pipeline infrastructure issues, but did they work as intended?
How does Winter 2024-25 Compare to Previous New England Winters?
With spot natural gas pricing averaging over $12/Dth last winter - the second highest winter average price over the last decade - we explore the impact these recent winter reliability efforts have had on New England’s spot gas price volatility.
Figure 3 compares Heating Degree Days (HDDs) measured in Boston and natural gas spot prices on the AGT pipeline over the last 10 years. Winter 2013-14 was one of the coldest, highest-priced winters in the last decade-plus due to a weakening of the polar vortex, which brought prolonged stretches of Artic air to the Midwest and Northeast. The next two highest-priced winters occurred in 2021-22 and this most recent winter, which we will use as our comparison points.
HDDs are a common way to measure how cold it gets. They reflect how far the average daily temperature falls below 65 degrees Fahrenheit and are often used to estimate how much energy is needed to heat buildings.
FIGURE 3 - Boston Winter HDDs Compared to Average Spot Natural Gas Prices, Competitive Energy Services, 2025
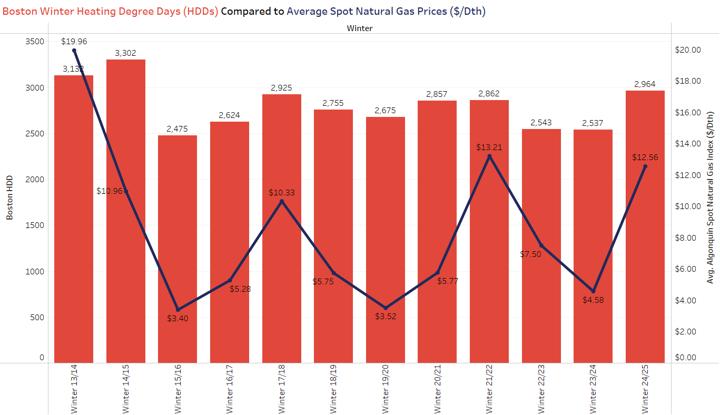
Figure 4 shows the average Algonquin natural gas spot price, Boston HDDs, and average spot price per HDD for winters 2013-14, 2021-22, and 2024-25. The average spot price per HDD is used to quantify the average cost per unit of heating demand. Figure 4 also focuses on December, January, and February, as those are the coldest and highest-priced winter months.
FIGURE 4 - HDD & Spot Prices: Winter 2013-14 compared to Winters 2021-22 and 2024-25, Competitive Energy Services, 2025
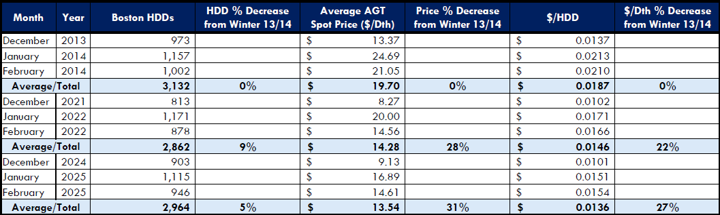
Again, winter 2013-14 was the coldest and highest-priced winter in over a decade as shown by 3,132 HDDs and an average spot price of $19.70/Dth, which comes out to an average price per HDD of $0.0187/Dth. While winters 2021-22 and 2024-25 were not quite as cold as 2013-14 - with 9% and 5% less HDDs - the average spot price was far less expensive. Winter 2021-22 averaged $14.28/Dth, while last winter averaged $13.54/Dth: 28% and 31% less than winter 2013-14. The average price per HDD decreases of 22% and 27% provide evidence that New England energy markets were better positioned to tolerate cold weather without experiencing extreme price spikes of the past.
FIGURE 5 - Spot Price Volatility: Winter 2013-14 compared to Winters 2021-22 and 2024-25, Competitive Energy Services, 2025
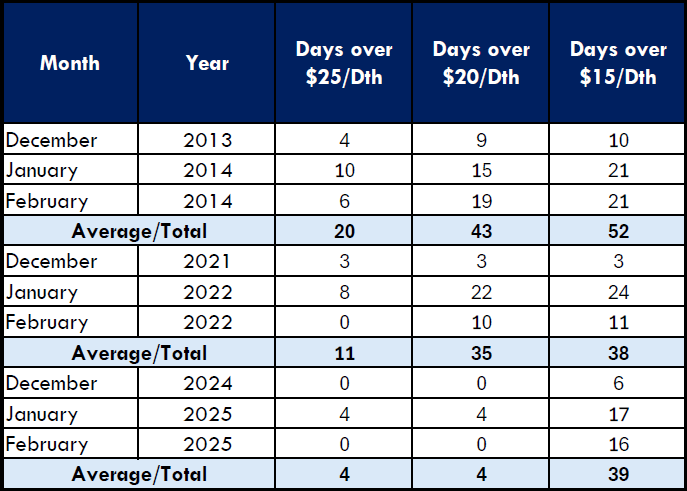
As shown in Figure 5, another key conclusion is New England’s winter spot gas prices have recently been less volatile than they were a decade ago. Aside from a four-day stretch in January 2025, when spot prices spiked above $33/Dth due to an unexpected downstream pipeline outage, daily prices never exceeded $20/Dth. This is a clear contrast to winter 2013-14, which saw 43 days above $20/Dth, including several days over $70/Dth.
During the peak hour of electricity demand from winter 2024-25, oil surpassed natural gas as the region’s dominant fuel source. When natural gas generators are maxed out, oil peaking plants are dispatched, creating an effective natural gas spot price ceiling around $20/Dth – matching the heat equivalent cost of oil at current market prices. This can be tied back to the fuel security initiatives implemented by ISONE incentivizing generators to store back-up and alternative fuel in case of tightened supply and demand. It can also be tied back to moderate oil and world LNG prices this past winter, as these fuels are the backstop when New England experiences a shortage of pipeline natural gas on the coldest winter days.
Key Take-Aways: What Does This Mean for Consumers?
While many factors influence the energy market, weather and supply and demand are often driving forces during the winter. AGT spot gas prices last winter were roughly 27% lower than the 2013-14 winter season. Along with considerable assistance from moderate oil and world LNG prices, ISONE’s preventative strategies helped reduce the volatility in spot prices this past winter.
Looking ahead to winter 2025-26 and beyond, there are several takeaways that can help mitigate exposure to high costs and ensure budget certainty:
- As always, the weather will play a critical role. While it is too early to confidently predict next winter’s weather, there are some models that can give us a rough idea of what to expect. As discussed in a recent CES blog titled Winter Weather Forecast: Bearish or Bullish?, weather experts look to the Pacific Ocean temperatures and the El Niño Southern (ENSO) to inform their long-term weather forecasts. Current models point to either a neutral or La Niña ENSO phase for next winter, meaning there is not yet a strong indication of a specific winter pattern. The ENSO phase will be an important factor that weather and energy experts will track over the coming months, influencing energy prices as we move through the summer and fall.
- Spot prices were high this winter, compared to recent warmer-than-average heating seasons, but they were less expensive and volatile when compared to prior very cold winters. However, it is important to note that this is a small sample size. If unprepared, it can only take just a handful of days exposed to expensive spot prices to far exceed a monthly energy budget. The desire for budget certainly is the reason most consumers elect to fix the price of natural gas. On the other hand, proper planning and budgeting, especially with an oil price cap effectively in place, can create relatively reliable cost estimates for consumers that elect contract structures with exposure to daily spot pricing.
- Both NYMEX and regional basis natural gas prices have declined from the recent two-year peak. Forward curves show prices easing in the outer years, suggesting some price relief could be sustained. The current “spring 2025 price dip” presents an opportunity to secure favorable long-term supply contracts. Consistently timing the market is nearly impossible to achieve, so “time in the market” still matters most. Continue watching for seasonal price dips and use them to your advantage by locking in multiple price hedges at those dips, diversifying your risk and cost.
- CES is continuously monitoring the energy markets and the topics discussed in this blog. It is never too early to contact a CES Energy Services Advisor to discuss how to manage your winter energy costs.
Photo by Imaginima