
By Sandy Beauregard, Director of Sustainability Services, and Catherine Nisbet, Associate Manager of Analytics
One of Competitive Energy Services’ core sustainability reporting products is the CES Carbon Tracker. The CES Carbon Tracker is an invaluable reporting tool that quantifies annual greenhouse gas (GHG) emissions and conveys these results in a comprehensive report format that can be shared with customers, employees, stockholders, or any other interested party. In addition, our team of Energy Services Advisors and Energy Analysts collaborates closely with clients throughout the process, from data collection to interpreting and sharing the results.
Producing an up-to-date greenhouse gas inventory is an important first step in any decarbonization initiative. The CES Carbon Tracker is designed to provide our clients with the emissions data necessary to inform goals or mitigation plans. The report is capable of presenting historical emissions as well as current emissions, which allows our clients to track emission trends over time and measure progress toward an emissions reduction target. Another valuable feature of the report is the ability to present customized emissions metrics such as emissions per square foot, employee, unit sold, or revenue. These types of measures provide critical insight into how emissions are trending compared to other performance indicators.
1. The Greenhouse Gas Protocol
When conducting a greenhouse gas inventory, CES adheres to Greenhouse Gas Protocol standards. Greenhouse Gas Protocol, established in 1998 by the World Resources Institute (WRI) and the World Business Council for Sustainable Development (WBCSD), sets the global standard for measuring greenhouse gas emissions. The first edition of GHG Protocol’s Corporate Standard was published in 2001 and outlines the required process and practices for businesses, NGOs, governments agencies, and higher education institutions to follow when conducting a GHG inventory. The Corporate Standard was later updated in 2015 with the inclusion of GHG Protocol’s Scope 2 Guidance which standardized guidance on the accounting for emissions related to purchased electricity and steam. GHG Protocol is currently reviewing and updating their Scope 2 Guidance which we anticipate will be published in 2026. CES closely monitors GHG Protocol updates to ensure our inventory methods align with the most up-to-date standard.
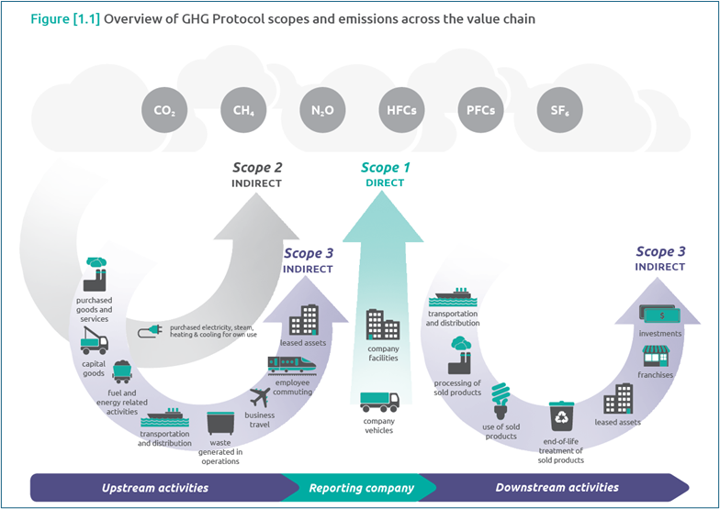
At the highest level, the GHG Protocol groups emissions into two categories: direct emissions and indirect emissions. GHG Protocol defines direct emissions as those that occur from sources owned or controlled by the entity. Onsite combustion of natural gas is one example of a direct emissions source. According to GHG Protocol, indirect emissions occur from sources not owned or directly controlled by the entity but resulting from the entity’s activities. One common example of an indirect emissions source is purchased electricity. As shown in the visual below, GHG Protocol further delineates emissions into three scopes:
· Scope 1: Direct emissions from owned or controlled sources (e.g., onsite combustion, company vehicles).
· Scope 2: Indirect emissions from the consumption of purchased electricity, steam, heating, or cooling.
· Scope 3: All other indirect emissions occurring in the value chain of the reporting entity (e.g., business travel, supply chain emissions, waste).
Figure 1. Greenhouse Gas Protocol Scopes and Value Chain Emissions, World Resources Institute (WRI)
2. Our Process
An important first step in any company’s GHG accounting process is establishing a baseline from which to measure trends in emissions going forward. The CES team collaborates closely with our clients to support this first step. GHG Protocol’s Corporate Standard advises that companies should select the earliest relevant year for which there is reliable data to use as the baseline. The CES team supports our clients throughout this selection process by providing a list of the data required to complete a baseline inventory and can recommend data sources to ensure a reliable baseline calculation. Some common examples of data sources that CES uses to complete GHG inventories are electricity, natural gas, and liquid fuels invoices for the reporting year. CES can rely on utility bills provided by the client or can gather this information directly from the utility portal if available. If you already have a baseline greenhouse gas inventory, CES can validate prior assumptions and methodologies.
Once the baseline year is selected and CES performs a thorough review of the data collected, CES calculates the baseline inventory following GHG Protocol standards and shares the results in a report format with our clients. The report is designed to be presented to and interpreted by a wide range of stakeholders.
3. Interpreting Your Carbon Tracker Report
The first page of the CES Carbon Tracker presents a summary of annual GHG emissions calculated using both location-based and market-based accounting methods. GHG Protocol established these two methods in their Scope 2 Guidance that was published in 2015. Location-based emissions reflect the emissions associated with grid purchased electricity using a regional average emission rate for your local power grid. Alternatively, market-based emissions incorporate contractual instruments that can be used to represent emission reductions. For example, if an entity has purchased the rights to the environmental attributes associated with an offsite solar project’s generation, the renewable energy credits (RECs) from this project can be incorporated into the entity’s market-based emissions total. In Figure 3 below, the reporting entity has purchased RECs to reduce roughly 30% of their Scope 2 emissions for the reporting year.
Figure 2. CES Carbon Tracker Annual Emissions Summary Table, Competitive Energy Services, LLC
Figure 3. CES Carbon Tracker Visual for Scope 2 Location and Market Based Totals, Competitive Energy Services LLC
In addition to annual totals, the CES Carbon Tracker report includes emissions totals from previous reporting years, allowing our clients to track their progress towards a specific emissions reduction goal over time. In Figure 4 below, the client has established an emissions reduction goal of 50% measured from the baseline year of 2010. Some clients may be interested in tracking normalized emissions as well as gross emissions. CES can incorporate customized visuals based on the client’s chosen metrics to show how changes in company operations are trending compared to emissions. These report features enable CES to advise clients on opportunities to reduce emissions further and achieve their sustainability goals.
Figure 4. CES Carbon Tracker Visual for Tracking Emissions Compared to a Goal, Competitive Energy Services LLC
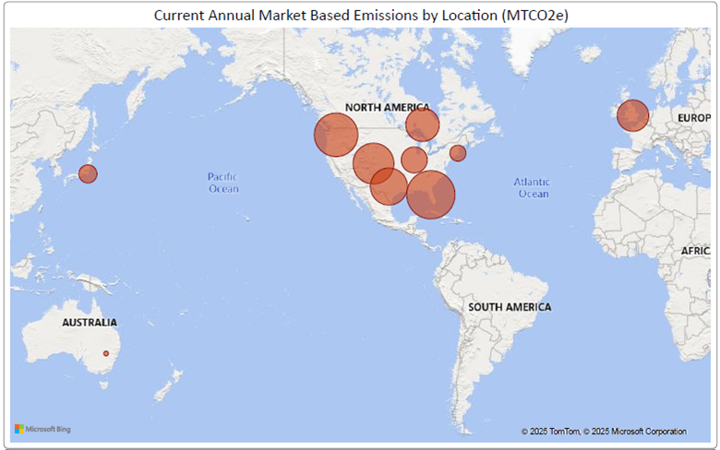
CES conducts greenhouse gas inventories for a wide variety of clients across multiple sectors, operating all around the world. The CES Carbon Tracker report can be tailored to show emissions at a location, state, or country level. As shown in Figure 5 below, the report can include a map comparing emissions totals across locations all around the world.
Figure 5. CES Carbon Tracker Map for Multinational Emissions Inventory, Competitive Energy Services LLC
4. Why Track Emissions?
Many CES clients are faced with the evolving task of quantifying and tracking their greenhouse gas emissions. Tracking emissions is critical for organizations seeking to set, manage, and achieve sustainability goals. Carbon Tracker enables a company to establish an emissions baseline, measure GHG emissions over time to assess performance toward carbon reduction goals, and evaluate the potential benefits of strategies and policies designed to reduce GHG emissions. Accurate data allows organizations to comply with evolving state, federal, and international regulations, communicate transparently with stakeholders, and identify and prioritize opportunities for emissions reduction.
CES calculates GHG inventories in accordance with the GHG Protocol and can support reporting to voluntary third-party frameworks such as CDP, SBTi, and AASHE as well as mandatory requirements such as the EU CSRD, Massachusetts Large Building Energy Reporting policy, or Boston’s BERDO.
Ultimately this is just one tool CES provides that enables clients to achieve their energy and sustainability goals, which has been CES’ guiding purpose for more than 25 years. If you would like help tracking your organization’s greenhouse gas emissions, evaluating emissions reduction goals, or complying with evolving emissions reporting programs and regulations, please reach out to a CES Energy Services Advisor today.
Photo by: Tone Fotografia