
By Zack Hallock, Senior Energy Services Advisor
If you’re like me, you look forward to warmer temps and long, carefree summer days. There’s much to consider and plan for each summer season – a result of dramatic temperatures and weather patterns that tend to lean to the extreme. What can you expect this summer – and what is the impact on the commodities markets? In this blog, I will share this season’s weather predictions and possible energy pricing scenarios.
By all accounts, the United States is expected to see hot and dry temperatures across much of the country this June, July, and August – with a few exceptions in the Rust Belt and Pacific Northwest. Moreover, summer of 2025 could rival 2024’s record-breaking heat, likely brushing past last year’s maximum temperatures.
What to Expect (High-Level Overview)
Without a doubt, heat and precipitation – and its ripple effects – will dominate the weather conversation for all of us. The Northeast – comprising Maine, Vermont, New Hampshire, western Massachusetts and eastern New York -- can expect to see higher than average precipitation levels, making for a muggy summer. Similarly, Florida, the Lower Lakes, and the Ohio Valley will experience higher than average precipitation levels.
On the other hand, the Deep South, Texas, Oklahoma, America’s Heartland (including Iowa, Missouri, eastern Kansas, and eastern Nebraska) and the Desert Southwest, can expect a hot dry summer. Extending beyond the lower 48 states, the northern half of Alaska is anticipated to be drier than normal, while the southern half is slated to be wet. Hawaii is primed to experience a wet, rainy summer, too. All other U.S. locations can expect to see a hot and dry summer.
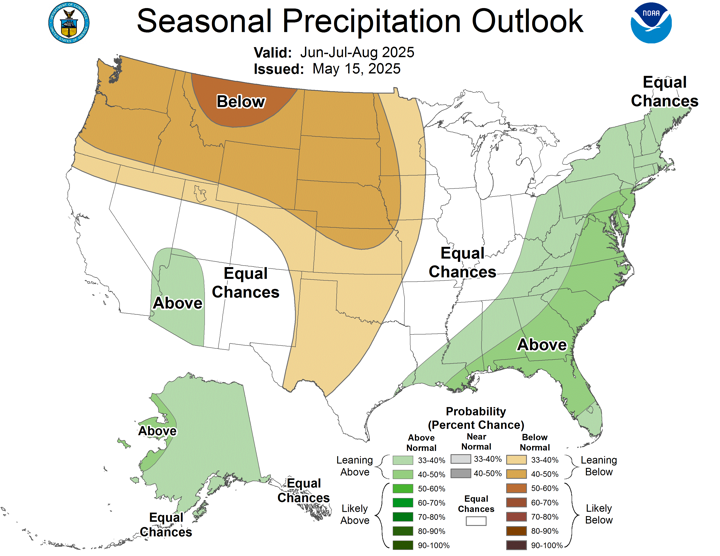
Each year, National Oceanic and Atmospheric Administration’s (NOAA) publishes its summer temperature and precipitation outlook. In their predictive model (Figure 1), NOAA anticipates persistent, elevated temperatures for most of the summer, particularly in the Rockies and the Northeast. In the Southeast, the bigger concern is the above-average precipitation expected during this same timeframe (Figure 2). The reason why this is significant is because precipitation yields higher humidity which is a stressor on grids. Anticipating grid stress is more difficult with elevated humidity verses a dryer, less humid scenario.
Figure 1: Seasonal Temperature Outlook, National Oceanic and Atmospheric (NOAA), May 2025
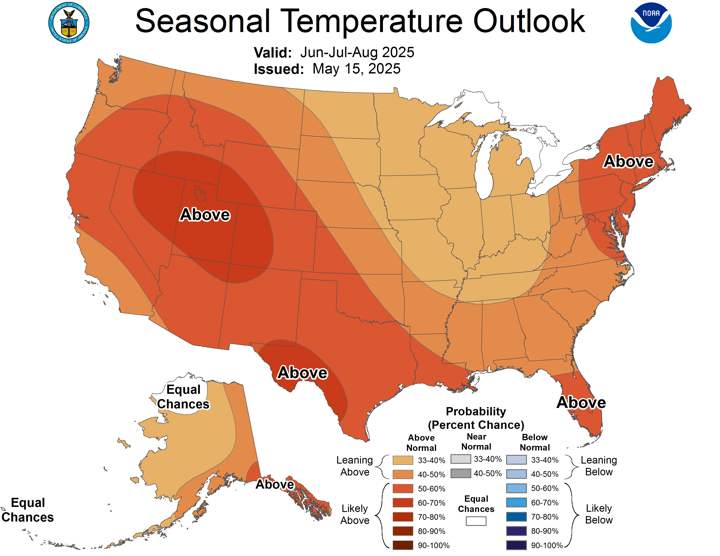
Figure 2: Seasonal Precipitation Outlook, National Oceanic and Atmospheric (NOAA), May 2025
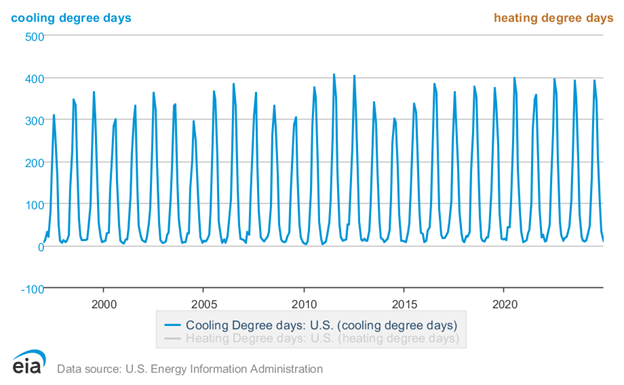
Further supporting this latest three-month temperature and precipitation forecast is the U.S. Energy Information Administration’s (EIA) Short-Term Energy Outlook (Figure 3), which shows that Cooling Degree Days have been steadily increasing over the last 30 years. Consistently elevated cooling degree days stress the electricity grid across states, regions, and the country as a whole. In addition, higher electricity generation required by the electricity grid will increase demand on natural gas used for power generation and likely cause commodity prices to increase.
Figure 3: U.S. Energy Information Administration (EIA), Short-Term Energy Outlook, May 2025
The Why: ENSO Neutral – Between El Niño/La Niña (flip flop)
The last confirmed La Niña event, which is a weather pattern characterized by cooler-than-average sea surface temperatures in the central and eastern Pacific Ocean, had its origins in 2021 and ended in the spring of 2023. The 2025 La Niña predictions are weaker version of the weather pattern of 2021.
In the autumn of 2021, my colleague, Max Webb, Managing Director of Pricing Analytics and I, collaborated on an article titled La Niña is Near: What Does That Mean for Energy Prices and Your Business? At that time, there were concerns that the upcoming winter would be a doozy (in other words, cold), leading to significant heating demand. As it turned out, that winter was mild, due to a weaker La Niña phase than anticipated. It’s likely this scenario could repeat itself this coming winter.
Wind Back the Tape: The Basics
Understanding the El Niño-Southern Oscillation (ENSO) is essential to grasp one of, if not THE most influential climate patterns on Earth. ENSO, which originates in the Pacific Ocean, affects the strength and variability of both the Pacific and Polar Jet Streams.
Though ENSO is a single climate system, it operates in three distinct phases: El Niño, La Niña, and ENSO Neutral. El Niño and La Niña are the most widely discussed, while the Neutral phase falls between the two and tends to be less persistent.
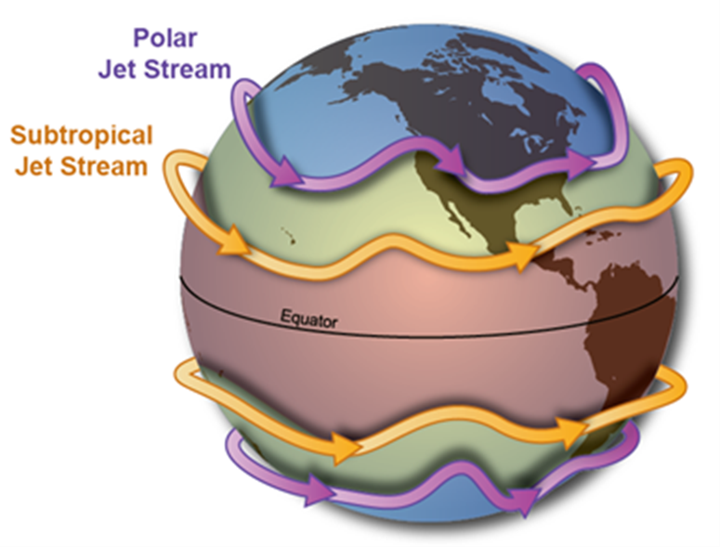
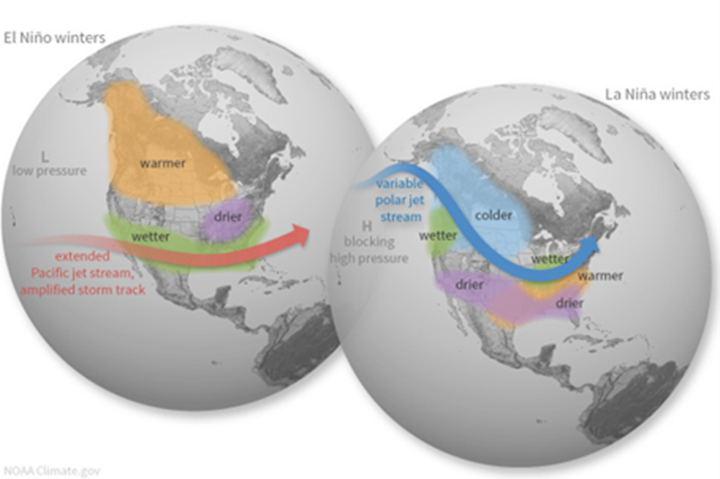
For North America, the most significant ENSO impact is the shift in the behavior and path of the Pacific and Polar Jet Streams (Figure 4). These high-altitude air currents play a critical role in separating warm and cold air masses, forming high-pressure ridges and low-pressure troughs that guide seasonal weather patterns across the U.S.
Tracking and understanding ENSO is critical because of its global influence on atmospheric circulation. In North America, it alters temperature and precipitation patterns by affecting the interplay between the Pacific and Polar Jet Streams. ENSO typically oscillates every three to five years, with each phase producing relatively predictable disruptions in weather. These tropical disturbances can also influence hurricane activity in the Gulf of Mexico and drought conditions in the western United States.
Figure 4: The Jet Stream (https://www.weather.gov/jetstream/jet)
La Niña
During the La Niña phase (Figure 5), sea surface temperatures in the equatorial Pacific are cooler than average. This keeps the Pacific Jet Stream farther north, making it less active across the southern U.S. As a result, the Pacific Northwest tends to be cooler and wetter while the southern U.S., from California to the Carolinas, often experiences warmer and drier conditions. The Ohio and Upper Mississippi River Valleys typically see increased precipitation, while the Northeast generally trends warmer.
El Niño
In contrast, El Niño (Figure 5) features above-average sea surface temperatures in the central and eastern Pacific, often driven by increased rainfall over the tropical Pacific and shifts in low-level surface winds, which blow more from the west than usual. These “westerly winds” carry enhanced moisture toward North America.
Figure 5: El Niño and La Niña: Typical ENSO Impacts (https://www.climate.gov/enso)
Prediction for Summer 2025 into Winter 2025-2026
The graph below (Figure 6) shows deviations from average sea surface temperatures in the Pacific Ocean around 170 degrees to 120 degrees longitude and 5 degrees north and 5 degrees south latitude –- just about smack dab in the middle of the Pacific Ocean. Temperature deviations from the norm in this area are the leading predictor of the ENSO cycle. The range of variability for the surface temperatures in the next calendar year is represented by the gray shading (cone).
Figure 6: NMME Season Forecast, The Northern American Multi-Model Ensemble, April 2025
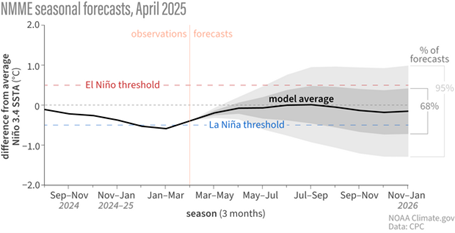
Objectively this is less of a conflicting model problem and more so a situation where the lack of clear influences is driving the low confidence interval on summer and fall 2025 and winter 2025-2026 modeling. There is no clear call for a significant increase in cooling degree days, but history shows us there is very low likelihood that we will see a meaningful reduction in cooling degree days this summer. Candidly, we should expect to see “hottest summer on record” headlines for the foreseeable future until the developed nations recognize the basic message of the Inter-Governmental Panel on Climate Change (IPCC) Sixth Assessment Report. For those unaware, the IPCC Sixth Assessment Report concludes that human-induced climate change is unequivocal and already causing widespread impacts on ecosystems and societies. It calls for immediate and sustained emissions reductions that are essential to limit global warming and secure a livable environment as we know it today.
Summer’s Impact on Commodities Pricing
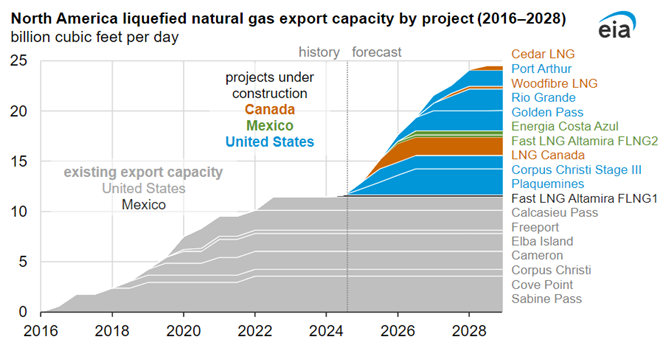
There is often a clear relationship between surging energy prices and cooling demand spikes across the country. However, the rise of liquid natural gas (LNG) exports in the United States in global energy trade is changing the historical precedent of simple supply/ demand relationships. With a clear roadmap of increasing natural gas demand for domestic producers, there is a gentle and consistent thumb on the scale keeping natural gas and thus electricity prices elevated to a certain extent. Due to the lack of clarity from an ENSO Neutral phase, weather will very likely be a short- to- medium-term factor for higher market volatility.
There is a guaranteed road map of demand for domestic natural gas producers, creating price premiums for the future availability of gas. The non-weather factor of future natural gas demand needed to supply LNG exports is driving the market. What that leaves us with is an opportunity for unexpected weather to create short-term volatility in the market. And on top of that, I would add that this short-term weather volatility will have an unusually large impact on natural gas prices, and thus electricity pricing. The resulting market reaction to volatile weather could be positive or negative for a business’ bottom line.
The following graph (Figure 7) representing natural gas export capacity from the U.S. Energy Information Administration is a way to visualize the thumb on the scale, which guarantees future demand.
Figure 7: North America’s Liquified Natural Gas Export Capacity by Project (2016 – 2028), U.S. Energy Information Administration
How to Take Action: CES Self-Help Demand Response Program
And now a word about electricity.
Competitive Energy Services’ Self-Help/Demand Response Program is a specialized and unique service offered exclusively to CES clients, providing them with timely updates and actionable alerts throughout the year. CES tracks weather conditions and past loads in New England. Using this information, we alert customers on those days, and during those hours, when we believe an annual system peak may occur.
Clients typically receive 6 - 12 notices each summer containing important information tailored to evolving conditions. These communications also include the level of certainty behind each alert to help guide decision-making. Forecasts and alerts are influenced by several key factors, including current weather conditions, the specific date, and the time of day.
Our alerts provide information to CES clients to enable them to voluntarily reduce electric loads if they are able. Should the annual system peak occur during one of these hours, customers that reduce electrical load will have lower capacity tags. There is never any obligation to respond to our notifications and, if clients can respond during the hour of the ISO-NE system peak, they retain 100% of the savings, realized through their electricity supply, depending on how their contracts are structured.
Annually each fall, Competitive Energy Services issues a peak day recap that appears on our website. Read about the 2024 peak day recap here.
Looking Beyond the Summer Heat and Leverage the Volatility
Overall, we are looking at a generally tight commodities market with some upward pressure throughout summer 2025. Weather variability will add brief, yet impactful moments of volatility in the electric and natural gas markets across North America. Newfound volatility can be an asset, not a threat to your budget if you are prepared.
If less extreme weather conditions led to lower demand for electricity and natural gas resulting in a price dip, this would be an example of leveraging volatility. Consumers could then capitalize on these moments of volatility to lock in prices for the future.
This article addresses many of the factors that are likely to drive significant energy market volatility, both regionally and nationwide, with potential impacts on short- and long-term pricing. If you have not already secured your energy rates for fall 2025 or even out into 2026, now is the right time to act. Current market conditions are presenting an opportunity to lock in futures pricing before any potential spike in the summer from unexpected cooling demand.
Please, contact an Energy Services Advisory Team member to discuss where opportunities exist and to learn more about the CES Self-Help Demand Response Program.
Photo by: Andrey Grinkevich