
By Dan Long, Client Development Coordinator
Here's a simple fact about New England electricity: Just one hour in the summer defines how you are billed for demand for 12 months. That hourly summer peak sets your capacity tag for the following power year as a representation of your contribution to overall grid stress on that one peak hour. Many customers don't think about these capacity costs until the bill arrives. By then it's too late.
Last summer proved exactly why capacity tag management matters. On June 24, 2025, New England hit its highest system peak since 2013. The system peaked at 26.5 MW between 6:00 p.m. and 7:00 p.m., driven by an early summer heat wave that caught many end users off guard. If your business was able to curtail load during that hour, kudos to you. If you missed this curtailment window, you may be kicking yourself.
And here's the problem: you can't control when the summer peak happens. You can only control whether you're ready when this event occurs.
At CES, we have a solution to tackle capacity tag costs through our CES Self-Help Program. CES Self- Help is a voluntary program we offer to our clients that provides advance notices each summer ahead of potential system peak events. With these notices, customers can prepare to curtail their load to lower their capacity tag and thus overall electricity costs for the year, as each facility's contribution to the summer peak sets their capacity tag costs for the year. We monitor the grid and weather patterns in real time and alert clients before a potential peak day event occurs. Not after. Before. That gives clients time to ramp down operations and shift loads during that critical hour. It sounds simple, because it is: being notified beforehand can be the difference in saving vs spending thousands on capacity-related charges throughout the year.
Each fall, Competitive Energy Services releases a peak day recap. Find further information here regarding the 2025 ISO-NE Peak Day recap.
Electricity Prices and Market Uncertainty
The electricity market heading into summer 2026 is defined by one word: uncertainty. Despite this uncertainty, we are here to help. Three factors are driving unpredictable costs for customers, and all three point in different directions.
The first factor we are monitoring is day-ahead-ancillary services (DAAS) and capacity market costs. Capacity prices have continuously increased over the past few years as the market tries to price transmission constraints, renewable integration, and reliability needs. Another DAAS regulatory component that impacted many ISO-NE end users over the past year. DAAS costs hit their peak during winter storm Fern between January 24-26 at $140 MWh. For an overview of DAAS, click here to view a short video titled “Day Ahead Ancillary Services: The Impact of ISO-NE’s Program on Electricity Users,” by CES’ Larry Pignataro, Director of Strategic Partnerships & Senior Energy Services Advisor.
Second, weather always remains a wild card.
The third and most critical factor, wholesale electricity prices, depends almost entirely on natural gas. As we know, natural gas markets, specifically New England Basis, are currently being shaped by the Iran conflict.
Here's where we are right now. As of the week of April 20, the NYMEX rolling 12-month strip is trading around $3.42/Dth, close to the bottom of the one-year range. Great. The real issue is basis. Natural gas basis is the cost of transporting natural gas from the Henry Hub, the physical pipeline interconnection point in Louisiana and the benchmark price for natural gas in North America, to your facility. Near term New England basis spreads have widened significantly because of pipeline constraints and reduced LNG import availability. With global LNG supplies disrupted by the Strait of Hormuz tensions and limited new export capacity in the U.S., Northeast natural gas pipelines are constrained. That pushes basis prices higher and raises power costs. Basis prices have come down slightly in the last month due to the introduction of warmer weather paired with healthy storage levels sitting around 108 Bcf, which is 5.8% above the five-year average. The 2027 calendar year Basis strip is currently trading at $2.86/Dth, almost $1/Dth higher than April 2025. This increase is driving not only the all-in wholesale price of natural gas but also the price of electricity. Over 50% of power generation is derived from natural gas fired generators in New England. To sum this all up, natural gas is the marginal fuel for power generation, basis prices have been highly volatile, and unfortunately, New England electricity markets follow suit.
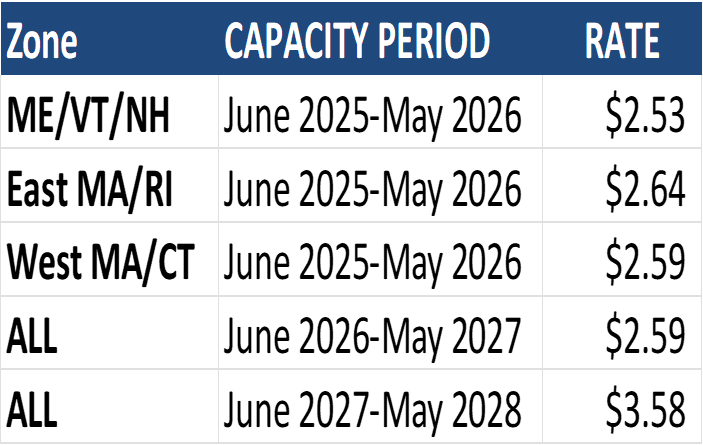
The pressing regulatory components: the forward capacity market and DAAS, add another layer. Current capacity prices are situated around $2.59/kW and are expected to increase in the next few years (See Figure 1 below). Upcoming capacity auction reforms in June 2027 have created regional market uncertainty as longer-term overall wholesale price impacts are unknown past May 2028. DAAS costs have trended downwards coming out of a record-breaking cold winter and have stabilized so far this spring. DAAS costs are dictated by the spot price of natural gas and could spike during peak day or near peak day events when natural gas becomes less available due to cooling needs.
FIGURE 1: New England Capacity Rates, ISO New England
Summer 2026 Weather Outlook
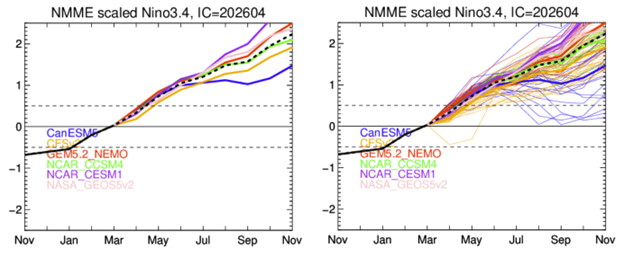
The National Oceanic and Atmospheric Administration (NOAA) is forecasting an El Niño transition for summer 2026. An El Niño phase is a warming pattern in the Equatorial Pacific Ocean off the coast of Ecuador that influences weather patterns across the globe. NOAA forecasts the status of this El Niño phase to reach “Super El Niño” status which is a stronger than average signal determined by sea surface temperature anomalies reaching greater than +2.0°C or higher. Figure 2 below shows the various long-range models showing the rapid progression towards a strong or “Super El Niño” phase going into this summer.
For more information regarding ENSO Cycles such as El Niño and La Nina please refer to the previous years Summer 2025 blog here.
Figure 2: ENSO Long-Range Forecast Models, North American Multi-Model Ensemble
For the West Coast, a strong El Niño summer typically brings lasting heat waves and drier conditions, with the Pacific Northwest expected to see the most intense heat. The Southwest often follows a similar pattern, with likely above-normal temperatures. The Great Lakes and Midwest tend to be slightly cooler, while the Southeast has a more variable pattern that often skews cooler and wetter.
For New England, the picture tends to be less dramatic. El Niño's summer influence is at its weakest across the Northeast. Temperatures tend to run near or slightly below normal historically, and precipitation can lean wetter than normal. In 1997 and 1998, one of the strongest El Niño summers on record saw moderate summer temperatures in New England rather than the heat waves that gripped other parts of the country. From 2015 to 2016 another El Niño cycle produced similar results for New England.
In Figure 2 below, NOAA's seasonal temperature outlook for May through July is showing above normal temperatures across almost the entire country, with the strongest signal centered around the West and the Southeast. The West is running the highest probability at 80–90% above normal, while a secondary hotspot is developing in the Southeast. The Upper Midwest and Great Lakes are the only region sitting at equal chances with no strong directional lean. For New England, the outlook favors slightly above normal temperatures.
FIGURE 3: NOAA Seasonal Temperature Outlook May-June-July, National Oceanic and Atmospheric Administration, National Weather Service Climate Prediction Center
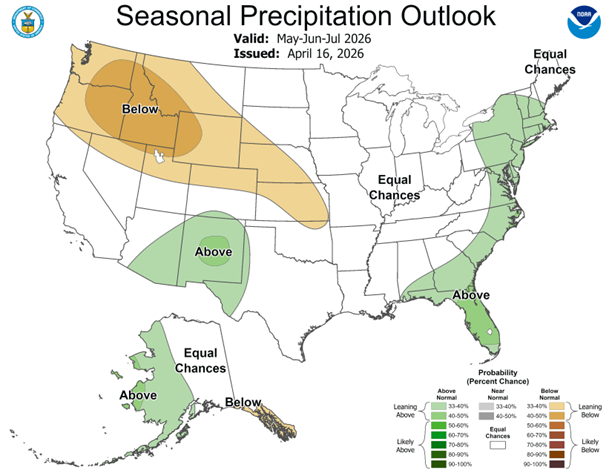
In Figure 4 below, on the precipitation side for May through July, the Northwest and Central Plains are trending drier than normal while the Southwest, East Coast, and Gulf Coast favor above normal precipitation. For New England, most of the region is forecasted for above normal precipitation heading into summer. Exceptions being most of Maine and parts of northern New Hampshire and Vermont, which are sitting at equal chances. Given the persistent drought conditions we experienced last summer, the above normal precipitation signal for much of New England is a welcome development heading into the season.
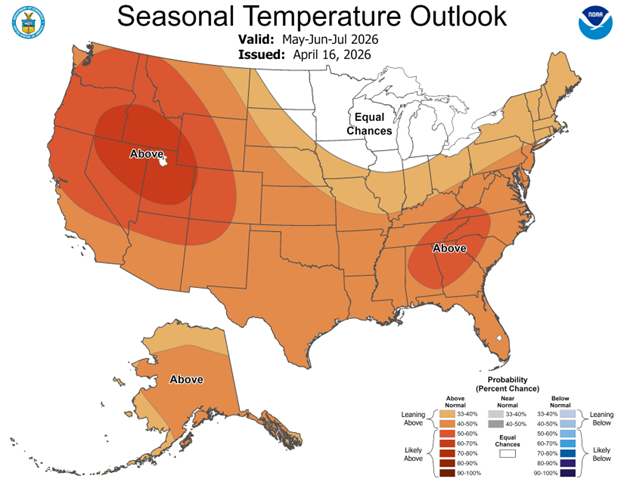
FIGURE 4: NOAA Seasonal Precipitation Outlook May-June-July, National Oceanic and Atmospheric Administration, National Weather Service Prediction Center
There's a lot in today's energy market that no one can predict or control: natural gas prices, power market swings, geopolitical tensions, regulatory outcomes, and the weather. What clients can control is their exposure to a significant cost driver on their electric bill: the capacity tag.
That tag is determined by a single hour on the peak day of the summer, and it sets capacity costs for the entire following power year. CES Self Help is built to take advantage of this structure. When system conditions point toward a potential peak, clients get an alert. They curtail. And when the summer is over, their tag reflects the action they took.
It's a straightforward value proposition: in a market full of variables, CES Self Help gives clients ownership of one cost component that would otherwise be left to chance. As you consider your actions for this summer and beyond, reach out to a CES Energy Services Advisor to learn more and participate.
Photo by: Ojoel