By Max Webb, Managing Director of Pricing Analytics and Zack Hallock, Energy Services Advisor
Now that we have taken off our Halloween costumes, eaten the leftover trick-or-treat candy, and put away the last of our spooky decorations, we are faced with an even scarier image: winter. Weather is a constant factor in the energy industry -- from determining the annual system peak which sets electricity cap tags, to extreme weather events calling fuel security into question, to hurricanes disrupting oil refineries in the gulf, and more.
As we make this transition from fall to winter, meteorologists and energy traders are shifting their focus and fine-tuning forecasts so that we can all be prepared. Though increasingly accurate, keep in mind that forecasting is just that, but we can get pretty close.
As you continue reading, keep in mind your own energy situation and needs. For instance, do you have supply contracts in place for your business through this winter? Is your contract fully fixed or does your contract leave some exposure to market volatility that is typically seen during the winter? If you do not have a supply contract in place yet for this winter, a supply contract that leaves you exposed, or if you’re not sure, feel free to reach out to the Energy Services team at Competitive Energy Services, who can provide a customized solution for you.
Winter Weather Basics
What if you knew forecasts for winter conditions were predicted months in advance simply based on average Pacific Ocean equatorial sea surface temperatures? Although this type of forecasting may seem like a long shot, there is some merit in this idea due to the semi-predictable nature of the El Niño-Southern Oscillation, or ENSO for short). If you’re a skier, January and February of 2022 will be an ideal time for you to head for the slopes in Vermont, New Hampshire, and Maine!
In addition to scoping out the best lines on the weekends, this ENSO pattern has us at CES thinking practically about the impact on our energy infrastructure in New England. Naturally, as we shelter down for old man winter to arrive, we see heating demand rise and/or become quite volatile.
To unpack this Pacific Ocean/ New England ski season correlation, it helps to understand one of the most important recurring climate phenomena on the planet, the El Niño-Southern Oscillation, or ENSO. This pattern in the Pacific impacts the strength and variability of both the Pacific and Polar Jet Streams, which typically results in a downstream effect on the Arctic based Polar Vortex. Though ENSO is a “single” climate phenomenon, it has three phases, two of which are commonly discussed: “El Niño” and “La Niña.” The third phase of ENSO is “Neutral,” which falls directly center of the continuum and does not persist like “El Niño” and “La Niña.”
It is important to not only track but understand the ENSO pattern’s ability to change the global atmospheric circulation, which in turn, influences temperature and regional precipitation in North America via interplay between the Pacific and Polar Jet Streams. This ENSO pattern shifts back and forth semi-regularly every three-to-five-years and each phase triggers predictable disruptions of temperature and precipitation. As these changes upset the large-scale air movements in the tropics, this effect can impact the strength and variability of both hurricane seasons in the Gulf of Mexico and seasonal drought conditions in the Western U.S. The maps below represent a typical El Niño vs. La Niña pattern on a North American winter.

Figure 1: El Niño and La Niña: Typical ENSO Impacts (https://www.climate.gov/enso)
It is important to not only track but understand the ENSO pattern’s ability to change the global atmospheric circulation, which in turn, influences temperature and regional precipitation in North America via interplay between the Pacific and Polar Jet Streams. This ENSO pattern shifts back and forth semi-regularly every three-to-five-years and each phase triggers predictable disruptions of temperature and precipitation. As these changes upset the large-scale air movements in the tropics, this effect can impact the strength and variability of both hurricane seasons in the Gulf of Mexico and seasonal drought conditions in the Western U.S. The maps below represent a typical El Niño vs. La Niña pattern on a North American winter.
During La Niña, the equatorial Pacific Ocean surface temperatures are below average. This causes the Pacific jet stream to remain in the Northern Pacific which means the jet stream is less reliable across the southern tier of the United States. The Northwestern states tend to run both cooler and wetter than average, which is typically a skier’s dream. Additionally, the southern half of the U.S. from California to the Carolinas tends to be both warmer and drier than average. Farther north/central, the Ohio and Upper Mississippi River Valleys may be wetter than usual. The northeast trends warmer than average across the whole pattern but allows opportunity for significant cold intrusions due to a shift on the Polar Vortex (PV).
During El Niño, these deviations from the average are approximately (but not exactly) reversed. A warming pattern of the ocean surface -- or above-average sea surface temperatures – in the central and eastern Pacific are partially due to increased rainfall over the tropical Pacific Ocean, less-so over the Indian Ocean. The low-level surface winds tend to start blowing in an unusual direction as “westerly winds” and bring unusually high moisture to North America.
For North America, the most significant impact from this pattern is the shift in the paths or interplay between the two mid-latitude Pacific and Polar jet streams. These high-level channels of air play a major role in separating warm and cool air masses via high pressure “ridges” and low pressure “troughs” which direct seasonal weather trends across the U.S.

Figure 2: The Jet Stream (https://www.weather.gov/jetstream/jet)
The last major factor that interacts with the ENSO and jet streams is the ominous Polar Vortex (PV). In particular, the relationship between the PV and the jet streams are simple to understand but have swift and significant impacts on regional temperatures. As the jet stream oscillates between high and low pressure, it allows for these “ridges” and “troughs” to open the door for a cold air intrusion, thus an active PV. Typically centered around the northern polar region, the PV is not guaranteed to become active but follows weaking or weaker high-pressure ridges. Specifically, the strength and position of the eastern pacific/western Canadian ridge dictates the possibility of PV intrusion in the U.S. When this ridge remains firm, it opens the door for low pressure to enter the central U.S. However, if it weakens or turns into a lower pressure trough system, it leaves the PV with no entry point – thus passing by the northern USA – and remaining over Canada.
These variable patterns lead to conversations around preparation for extreme events, or in the sense of New England, possible fuel security concerns. A good example of this eastern pacific ridging firming up or decaying is precisely what happened to the center of the United States in February this past winter. Everyone remembers the headlines out of Texas, but the real story is that the whole center of the country experienced an abnormally low temperature deviation for almost two weeks straight. The stability of the western Canada ridging along with the intensity of the Polar Vortex was a perfect storm culminating in the catastrophe we all witnessed.
Winter 2021-2022 Call
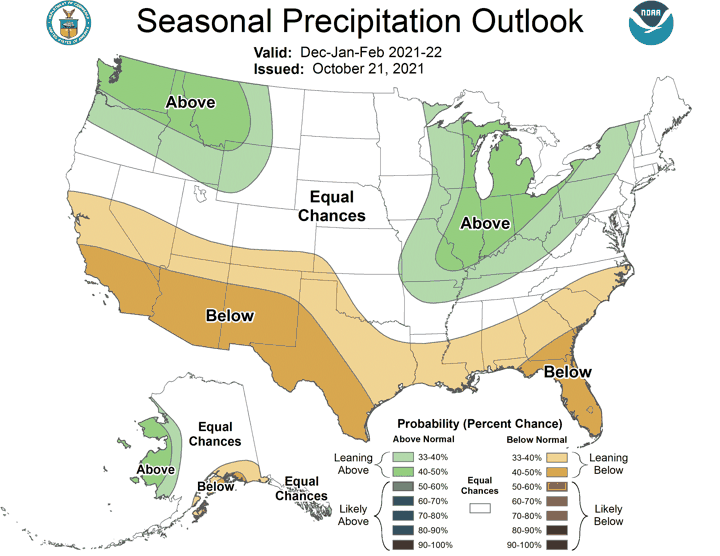
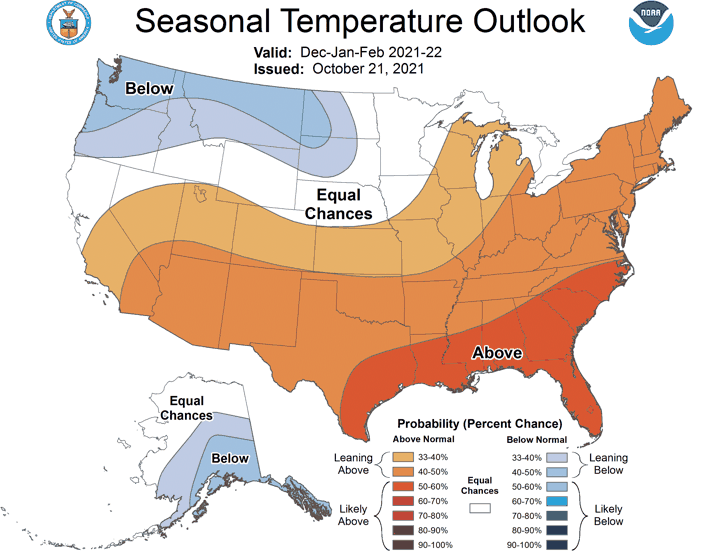
So, that leads us to consider what the current call is for winter in the United States, or specifically for New England? Without a doubt we are starting the season on a weaker-to-moderate La Niña. This will result in the greatest colder anomalies centered around the Pacific Northwest and Northern Plains, with on-average warmer-than-usual temperatures across the northeast throughout the entire winter season. The northeast will likely see a reversal of this trend for the mid-December to later January period before turning mild again in mid- Feb. In late winter (March through mid-April) these mild La Niña’s can be extremely variable but then tend to trend colder than average in most models. Historically, La Nina events feature at least one extended bitter cold intrusion that disrupts the slightly above average longer-duration trends. The strength of these cold intrusions and their severity will be highly dependent upon the position and force of the eastern Pacific upper-level ridge, and any disruptions to the Polar Vortex.


Figure 3: Polar Vortex (https://www.cpc.ncep.noaa.gov/products/predictions/long_range/seasonal.php?lead=2)
Energy and Rising Prices
Now that we understand the underlying factors that can influence winter weather, let us step back and put what we know into the perspective of the energy industry. You have probably noticed at the gas pump or when filling up your home heating oil tank that energy prices have skyrocketed since last fall.
In our October blog titled “Why Have Natural Gas Prices Increased So Much?” Keith Sampson, Senior Vice President for Energy Services and Chris Brook, Director of Natural Gas & Energy Services explain the reason behind gas price increases, current energy market fundamentals, and how we got here. To summarize their conversation, the rise in prices starts with supply and demand. As the world went into lock-down at the beginning of the pandemic, energy demand quickly fell, which resulted in near all-time low energy prices. As demand and prices fell, so did energy production. As we continue the return to normal, energy demand has returned to above pre-pandemic levels. The problem is production has not returned at the same pace. We have now gone through last winter and another record hot summer at lower-than-normal production levels all the while the U.S. has been chipping away at natural gas inventories. As we approach the upcoming winter, storage levels are 5% below the 5-year average, and 13% below this time last year. This has driven the NYMEX rolling 12-month strip price up $1.44/dth since this time last year. Natural gas is the largest fuel source used to generate electricity in the northeast, so as gas prices go up so do electricity prices.
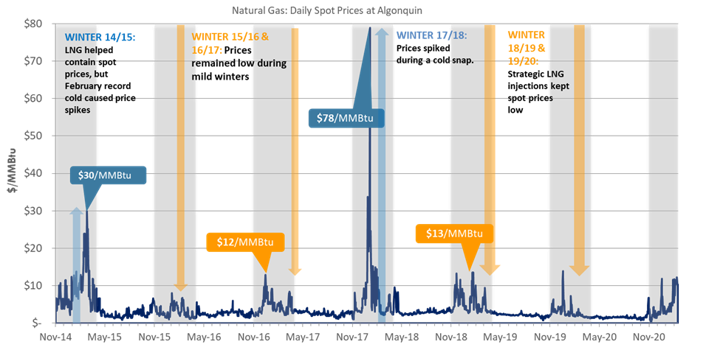
In addition to natural gas commodity price increases, we have also seen New England natural gas basis prices increase. Basis is the cost to reserve space in the interstate pipeline to transport gas from the point of production to the local distribution gate. The northeast has always been in a tricky spot when it comes to winter fuel because of a lack of natural gas pipeline infrastructure. Recently, the northeast has turned to liquified natural gas (LNG) as a backstop to help boost generators on the coldest days of the winter. The LNG market has acted as a “cap” on the winter weather price volatility that we have witnessed during cold snaps in past winters (see graph below).

Figure 4: Natural Gas: Daily Spot Prices at Algonquin (produced by Competitive Energy Services, LLC)
What’s causing concern for this winter is that the U.S. has continued to increase its ability to ship liquified natural gas around the globe. World-wide markets are trading at a premium versus what we are seeing domestically, and we expect global prices and demand to remain steady or increase throughout the winter. To keep pace with the global markets, U.S. New England basis prices will also likely rise, so that on the coldest days, there is enough of a price signal to bring LNG to the northeast.
Customer Strategy Section
There is concern that a prolonged stretch of cold weather or a severe weather event will put stress on the northeast energy grid which would likely cause large spikes in spot markets. To determine whether the upcoming winter will have near term impacts on your business, the first place to look is at your supply contracts. Most electricity contracts are a “fixed” contract, which means your electricity supply rate will not change until the end of the contract term. Natural gas is a little different. While you may have the basis and NYMEX portions of your contract locked, you may be subject to daily or monthly usage bandwidths unless you have a full requirements (unlimited bandwidth) contract. Those daily or monthly usage bandwidths are either 0% or 10% from your baseline volumes. The volume used above or below your bandwidth will be cashed out at market costs. Generally, we expect to see higher than normal spot prices in the winter, however, during a cold snap the market price could be much higher than your contract price. For liquid fuel customers, keep an eye on your run rate compared to contracted volumes. If we experience a consistent stretch of cold weather, you could run through contracted gallons quicker than expected. In that case, you may take some deliveries at market price toward the end of the heating season. Also keep an eye out for any extreme cold in any upcoming 10–14-day weather forecasts. Along with most industries, there is a labor shortage in the trucking industry, so it may be even more difficult to receive liquid fuel deliveries this winter, especially on a short notice.
Conclusion
We know a La Niña winter is imminent for the U.S., leading to a generally mild winter for the northeast with the understanding that there will be swift and significant cold intrusions. Understanding when those swift intrusions are on the doorstep hinges on our ability to identify the strength and position of the classic western Canadian ridging setup. Indirectly this will hint to Polar Vortex anomalies which can offer up similar events to Texas in February of 2021.
What does this mean for energy consumption and budgeting this winter? Simply put, have a plan in place and do not be afraid to ask those “what if” questions. It is important to understand your current contract structures. Commodities are “risk-on” headed into this winter with all current outlooks pointing to a minimal chance that we will see relief in the short term. In the vein of proactivity, everyone should be considering next winter already. Again, if you are unsure or want to double check the status of your energy contracts, please reach out to your CES Energy Service Advisor.
